Churn Prediction for Sumauto
Developing predictive models to identify advertiser churn in Spain's leading vehicle marketplace platform
The Problem
Business Challenge
- •Sumauto is a marketplace for vehicle classified ads
- •High customer churn rates affecting revenue
- •Need predictive models for proactive retention
- •Understanding churn patterns and triggers
Key Discoveries
Gaming the System
We discovered that many users appear to "game" the system by churning and returning repeatedly, likely to take advantage of new customer discounts and promotions.
Data & Methodology
📊 Advertiser Profiles
Demographics, location, contract history, group affiliations
📈 Monthly Metrics
Ad performance, engagement, pricing, premium services
❌ Withdrawal Records
Churn events, reasons, types, and recovery patterns
Feature Engineering Approaches
Simple Aggregation
Monthly features per advertiser
Temporal Accumulation
3-month rolling averages and trends
Time Series Structure
Sequential data for each advertiser
Model Performance
PR-AUC Results by Prediction Horizon
Best Model: Random Forest with max_depth=10
Churn Rate Distribution by Prediction Horizon
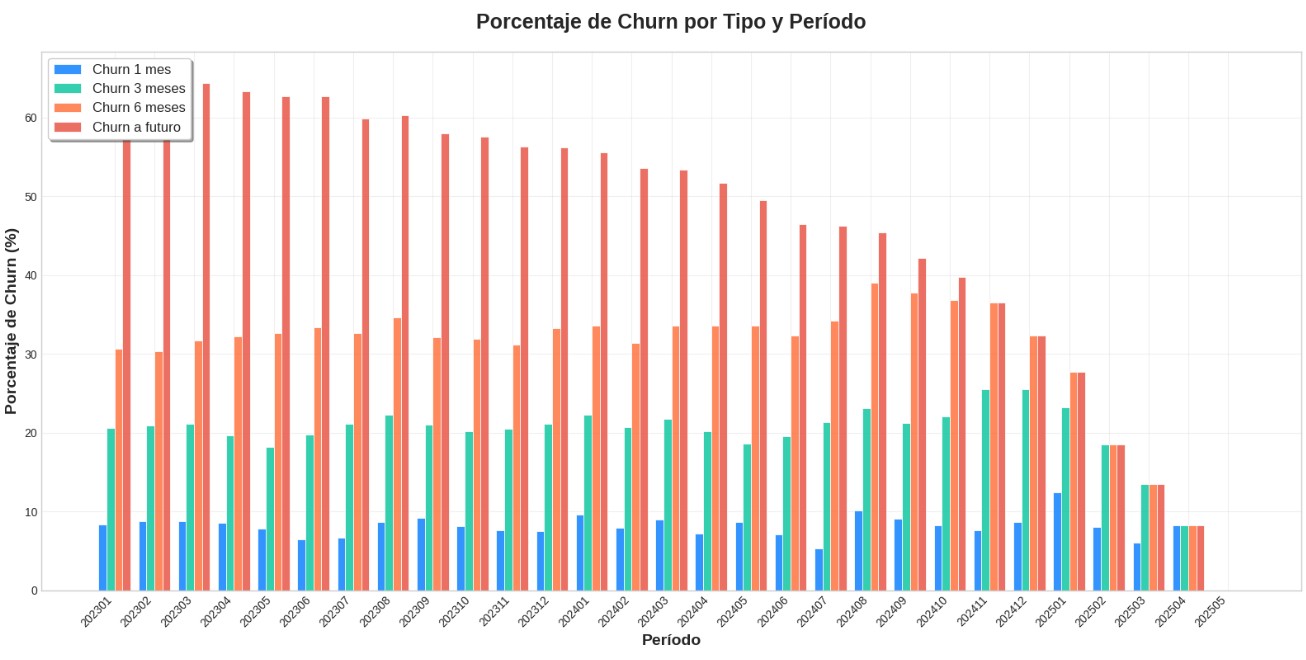
Distribution showing how churn rates vary across different prediction horizons (1, 3, 6 months, and future)
Key Model Insights
- ✓Longer horizons show better predictability
- ✓Simple aggregation outperformed complex temporal features
- ✓Random Forest showed best overall performance
Top Predictive Features
Key Business Insights
Evidence of System Gaming
Our analysis revealed clear patterns of users repeatedly churning and returning, likely exploiting new customer promotions and discounts.
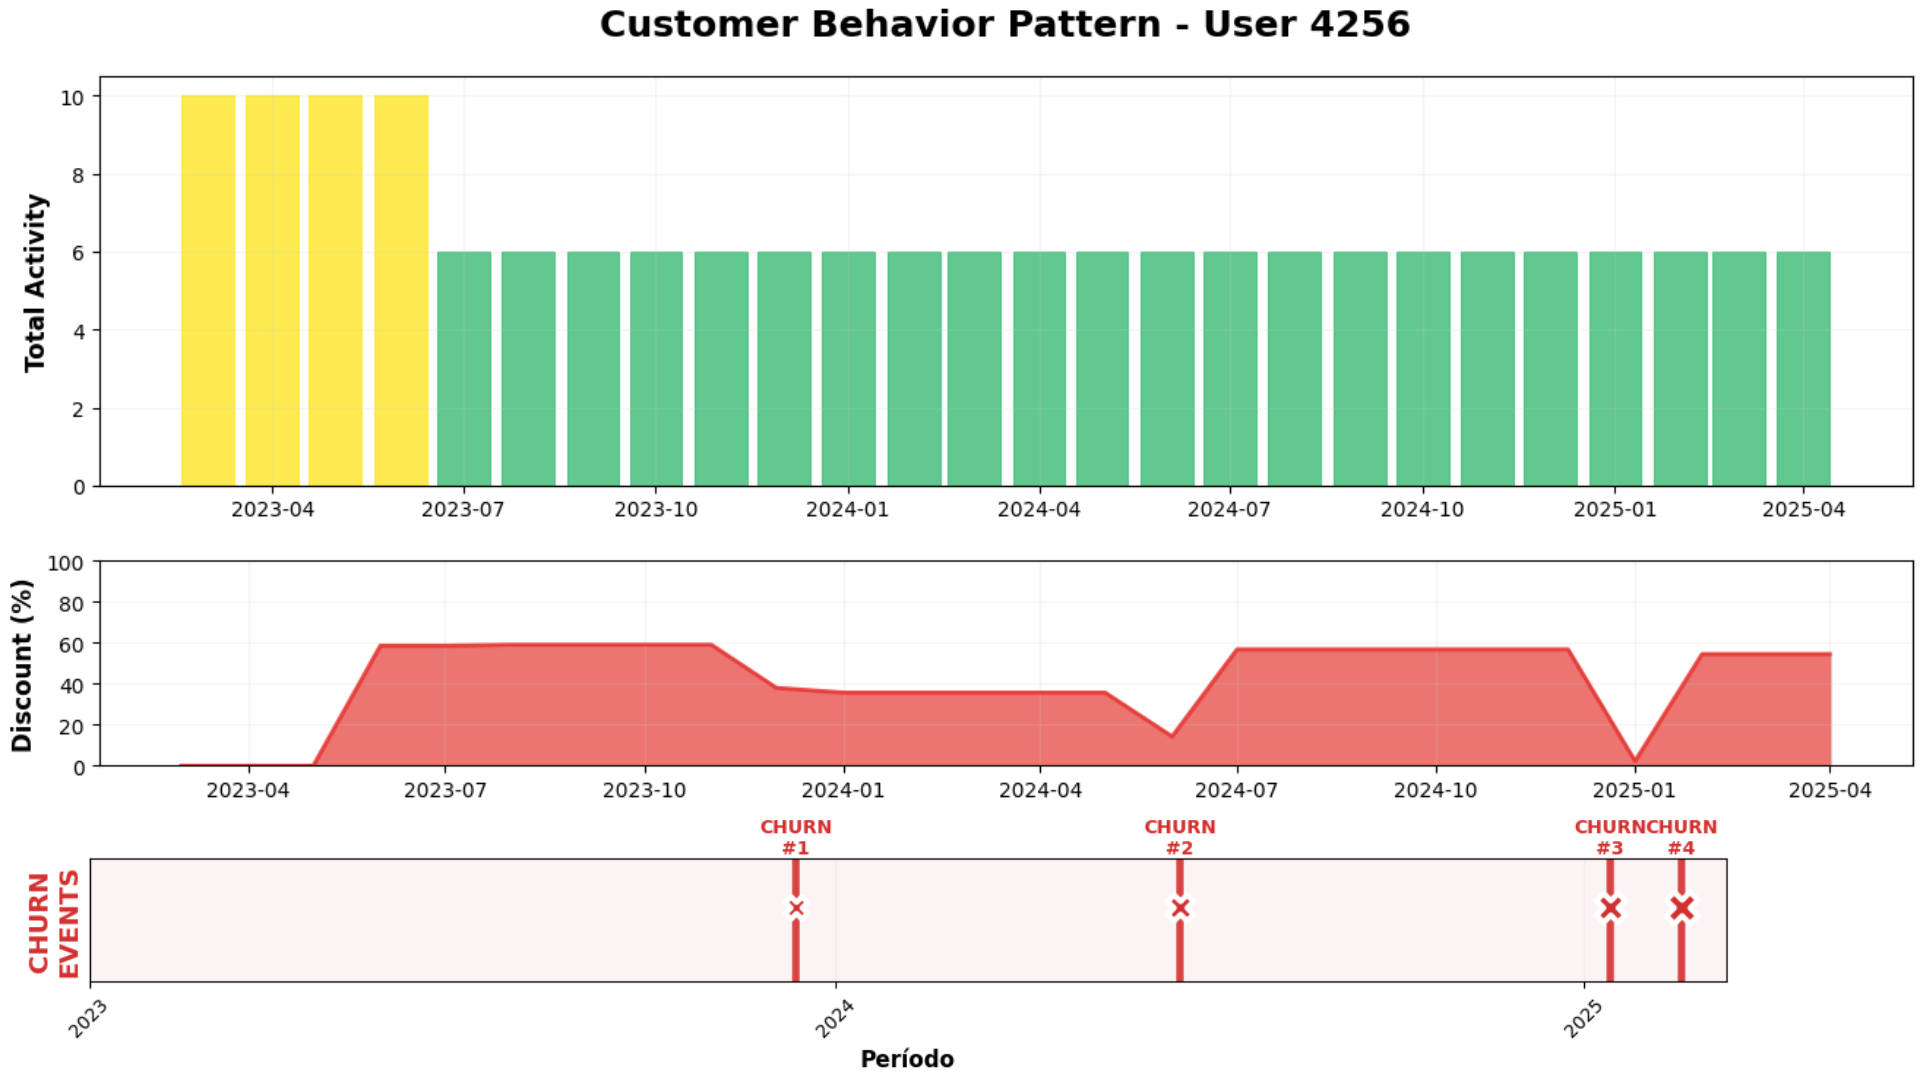
Example: User 4256 showing pattern of activity, churn, and return cycles across 2 years
Market Opportunities
- 📈Premium ads show significantly higher efficiency
- 🎯Madrid & Barcelona concentrate premium usage
- ⚠️48.4% average discount rate with declining trend
- 🔍Engagement drops can serve as early warning signals
Strategic Recommendations
1. Gaming Detection
Implement systems to detect and prevent discount abuse
2. Proactive Retention
Use engagement drops as early warning signals
3. Discount Optimization
Reassess discount strategy to improve profitability
Project Team
Technology Stack
This project was conducted as part of the Zrive Applied Data Science Program
in collaboration with Komorebi AI consultancy